Chart: Bitcoin: Above $10,000 and turbulent but good

[A quick summary of some of the Bitcoin activity. This is a summary from a company that deals in Bitcoin. Jan]

We’ve now said goodbye to a fourth ‘red candle’ September in a row, with bitcoin’s price having dropped approximately 8% over the course of the month. Despite this, things have actually been relatively stable for bitcoin. We’ve even managed to sustain a new record – bitcoin has now closed above the $10,000 mark for its longest streak of 71 days in a row and counting.

Events this week have certainly tested that streak. First, we saw one of the world’s largest derivatives exchanges, BitMex, charged by the Commodity Futures Trading Commission (CFTC) for failing to prevent money laundering. Then, President Trump and seemingly most of his White House were diagnosed with COVID-19, sending the stock market into free fall – followed closely by the crypto markets. His decision yesterday to call an end to stimulus talks until after the election has also provided further uncertainty for the markets. With a month still to go until election day itself, it’s fair to say that this likely isn’t the last we’ve heard from Trump and Biden.

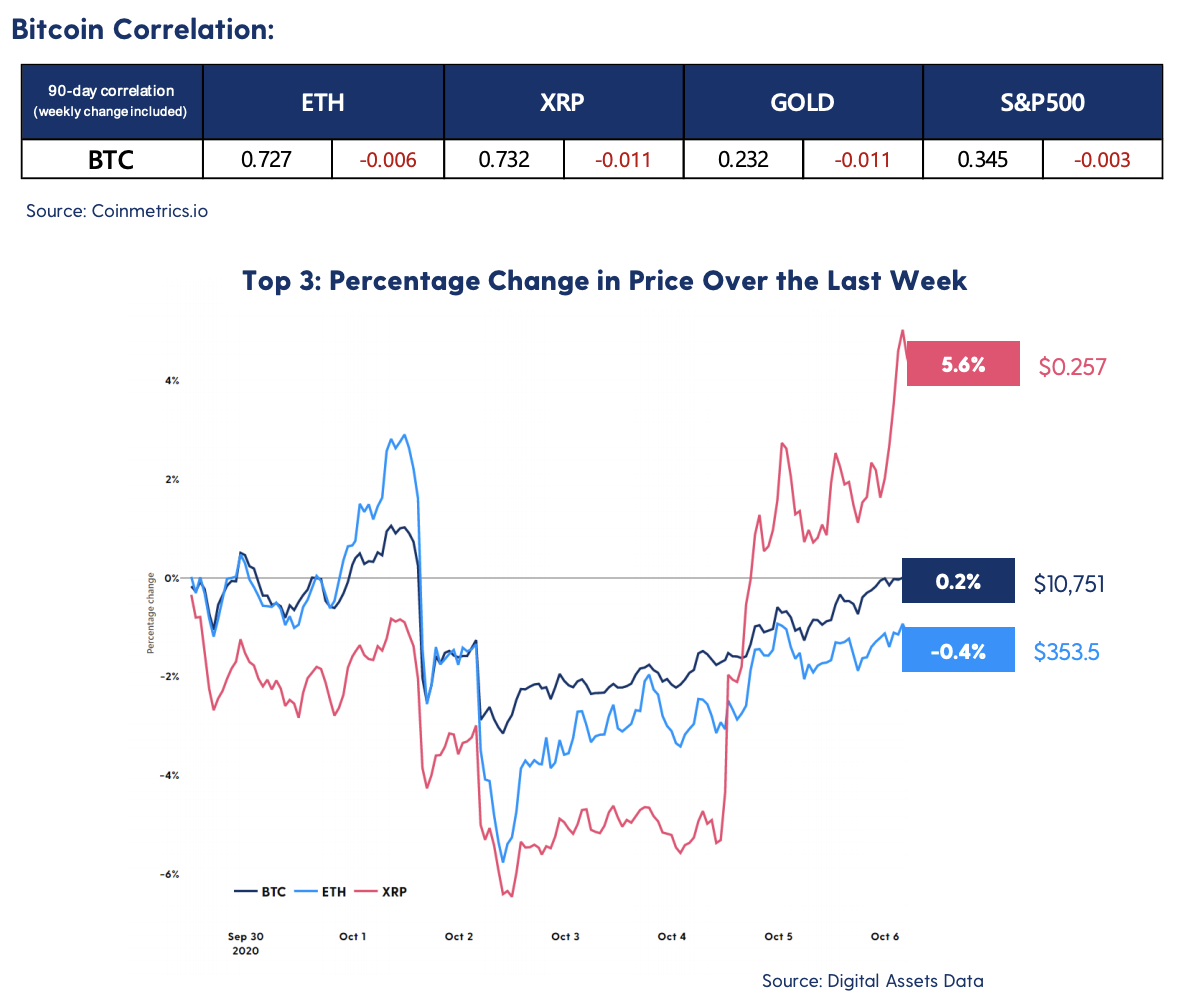
Percentage Change in Price Over the Last Week
In this revamped newsletter, we bring you the latest in on-chain cryptocurrency analysis. By analysing on-chain activity, we’re able to obtain a clearer picture of Bitcoin’s current state and what may come next. We look at the blockchain directly and analyse balances, transactions, and the overall activity of market participants. This gives us a unique insight into the future of the market.

These insights are provided in conjunction with IntoTheBlock (ITB). ITB is an intelligence company that leverages machine learning and advanced statistics to extract intelligent signals tailored to crypto-assets. IntoTheBlock tackles one of the hardest problems in crypto: to provide investors with a view of a crypto asset that goes beyond price and volume data. The Luno research team uses IntoTheBlock to dig deeper and get the most important insights about the crypto market.

On-chain positions shows strong support and resistance
On-chain positions
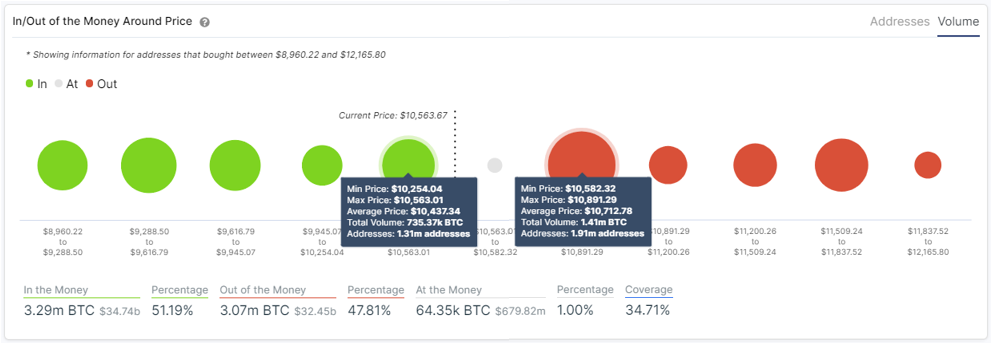
The In/Out of the Money Around Price shows price levels where Bitcoin addresses have previously bought, categorising addresses as in the money (profiting) or out of the money (losing money). The size of these clusters represents the volume of bitcoin held in current positions that was purchased in this price range.

Here, we can see that over 735,000 BTC was purchased by 1.31 million addresses between $10,254 and $10,563. This is expected to (and has been) an area of strong support as there will be buying pressure from holders to sustain this key range.

On the other hand, there’s a big area of strong resistance for bitcoin based on on-chain data. This resistance is located around the $10,700 mark, where 1.41 million BTC has been bought by 1.91 million addresses. This creates resistance from many of these addresses looking to close their positions to break-even.

By comparing these levels to those provided by technical analysis, we can verify buyers are expected to create support near the $10,200 range, while sellers will provide resistance around $10,700.

Bitcoin volatility is showing July’s Numbers
Buy crypto
As can be seen in the graph above, it’s clear that bitcoin has been more stable recently – with its 30-day volatility dipping below 21%. This is the result of bitcoin hovering around the $10,000 level for approximately 72 days.

At time of writing, the 30-day volatility stands at 20.71%. This period of low volatility was last surpassed in July of 2020, when Bitcoin recorded its lowest period of 30-day volatility ever with 15.35% after staying on the $9,000 mark for more than 90 days.

Despite the lack of volatility, Bitcoin network activity has been hitting new highs
Volatility
Daily active addresses provide a valuable metric for Bitcoin’s usage. While the number of addresses does not necessarily equate to the number of Bitcoin users, this indicator still provides a valuable approximation to Bitcoin’s daily activity. As we can see in the graph above, Bitcoin daily active addresses hit a two-year high a few days ago.

This is a clear indication that demand to use Bitcoin has been growing steadily, as reflected in the number of active addresses. Moreover, Bitcoin saw a similar pattern in early July when daily active addresses also reached a high while prices were trending sideways. This increase in demand preceded a 20% break-out.

Skip to toolbar